Big improvements demand attention to small details. Here’s how we’re making improving public transit performance easy.
Your public transit network is a well-oiled machine. You’ve crafted your schedules, trained drivers, and electrified your fleet. Your customer comms are timely and accurate, and data flows freely through your intelligent transit system.
But sometimes…
…you need to know when things aren’t going to plan.
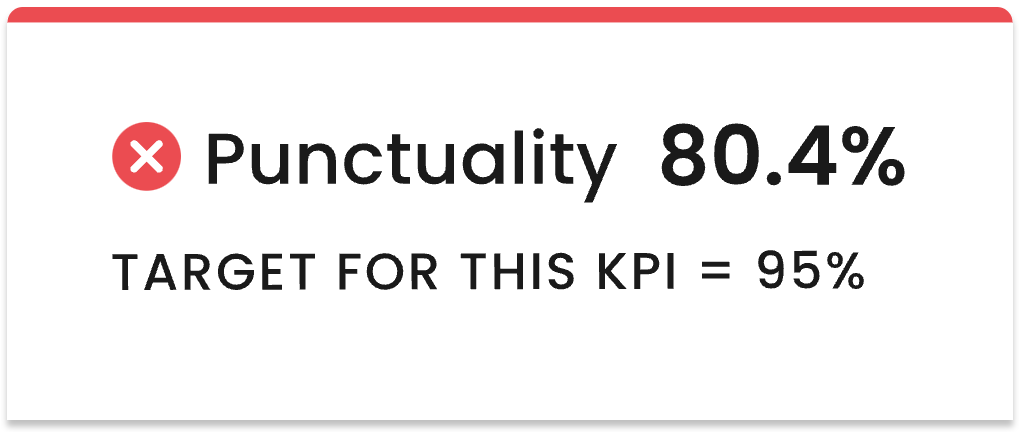
Disrupted services have real impacts on real people, from under-pressure bus drivers to stranded passengers, not to mention contractual implications, lowered trust in public transit, and increased cars on the road. Even a short-term blip can have a long-term impact. So how do we keep things running smoothly?
Legacy systems make surfacing on-time performance reports time-consuming and difficult. When things go wrong, you need to know what happened – fast. Uncovering why a trip (or, indeed, an entire service) went awry is a crucial step in making improvements that can lift a whole network.
That’s Why We’re Making It Easy To Investigate Individual Trips
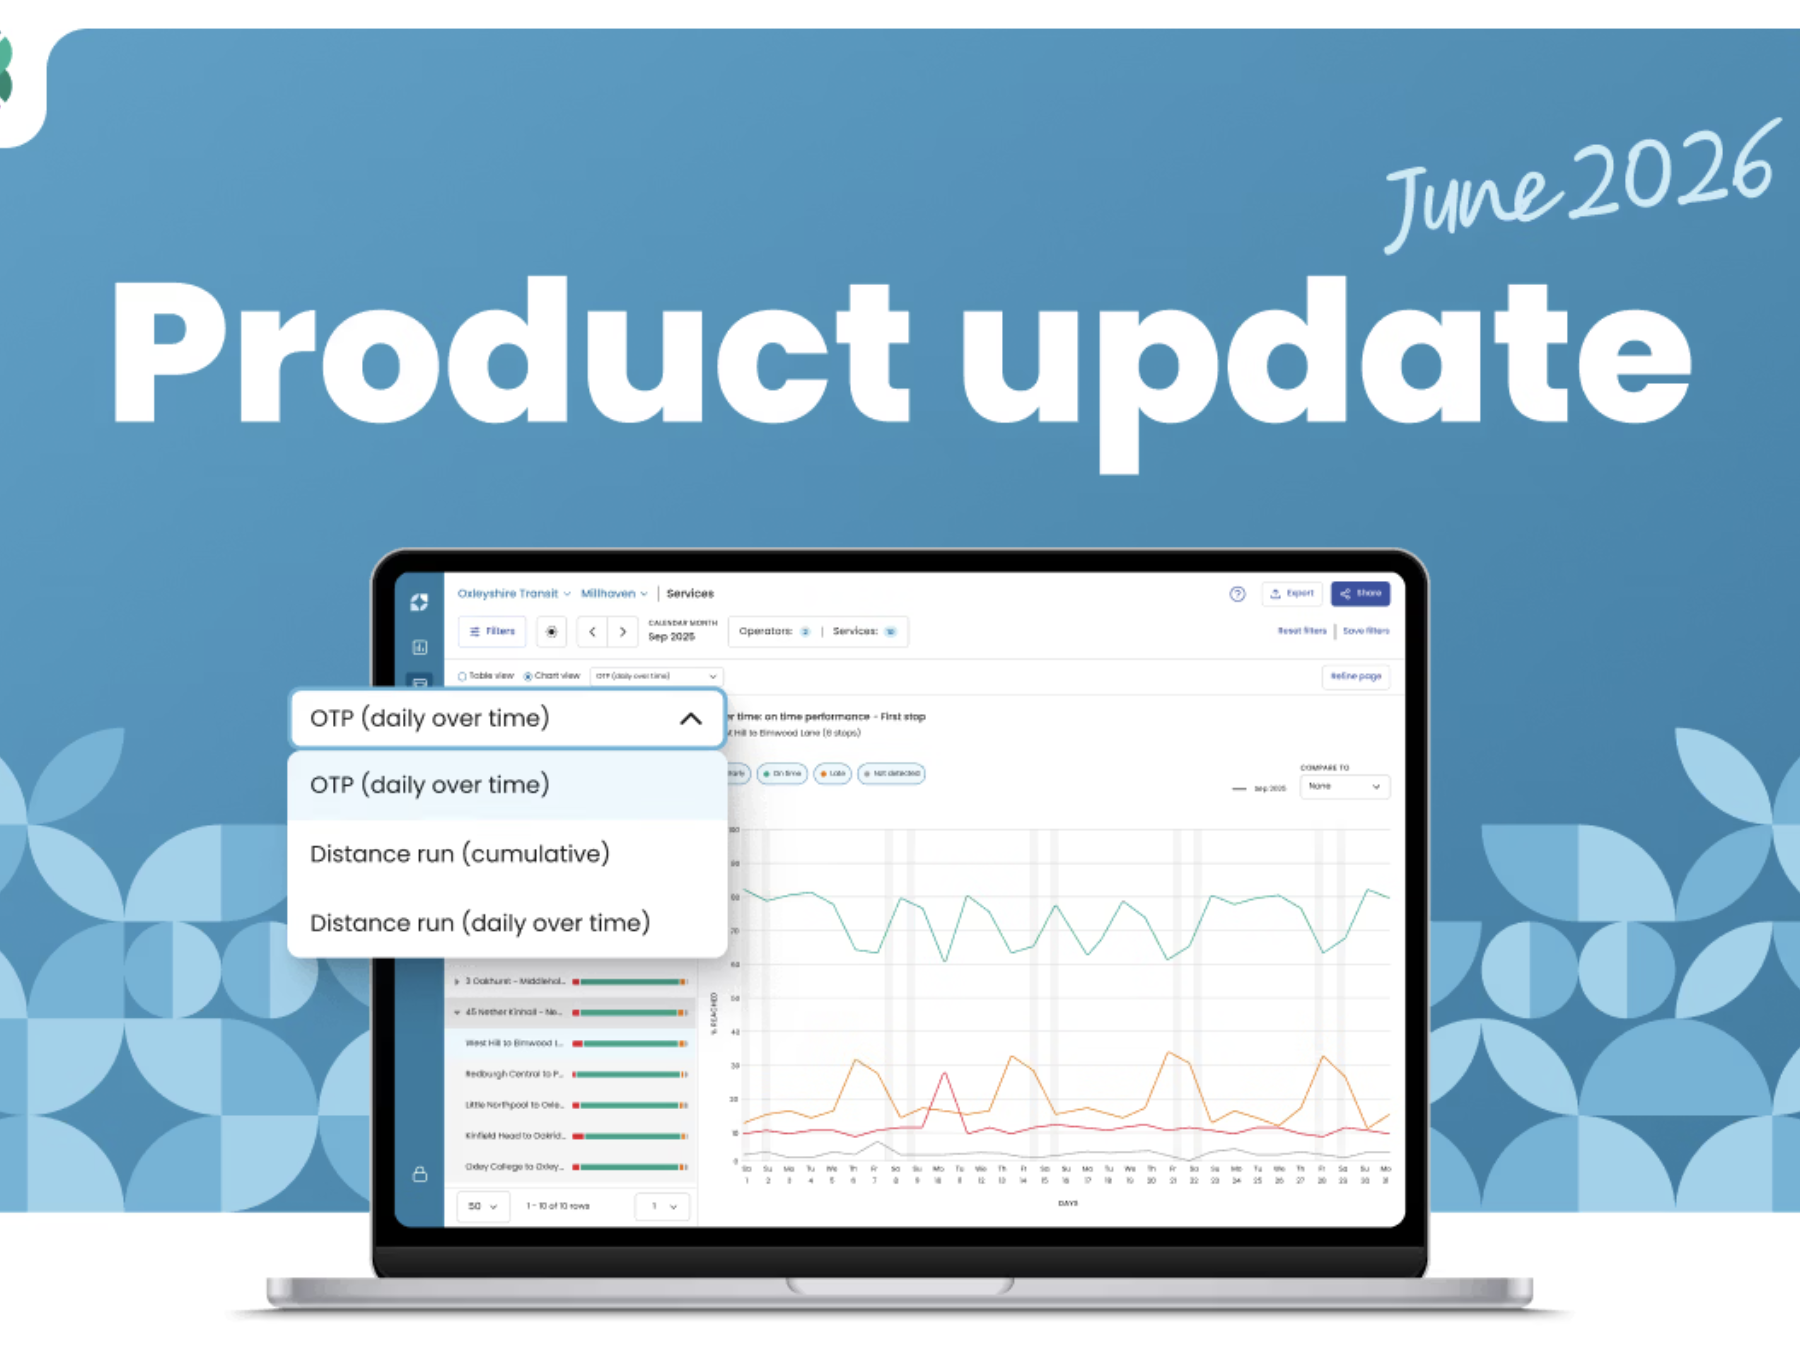
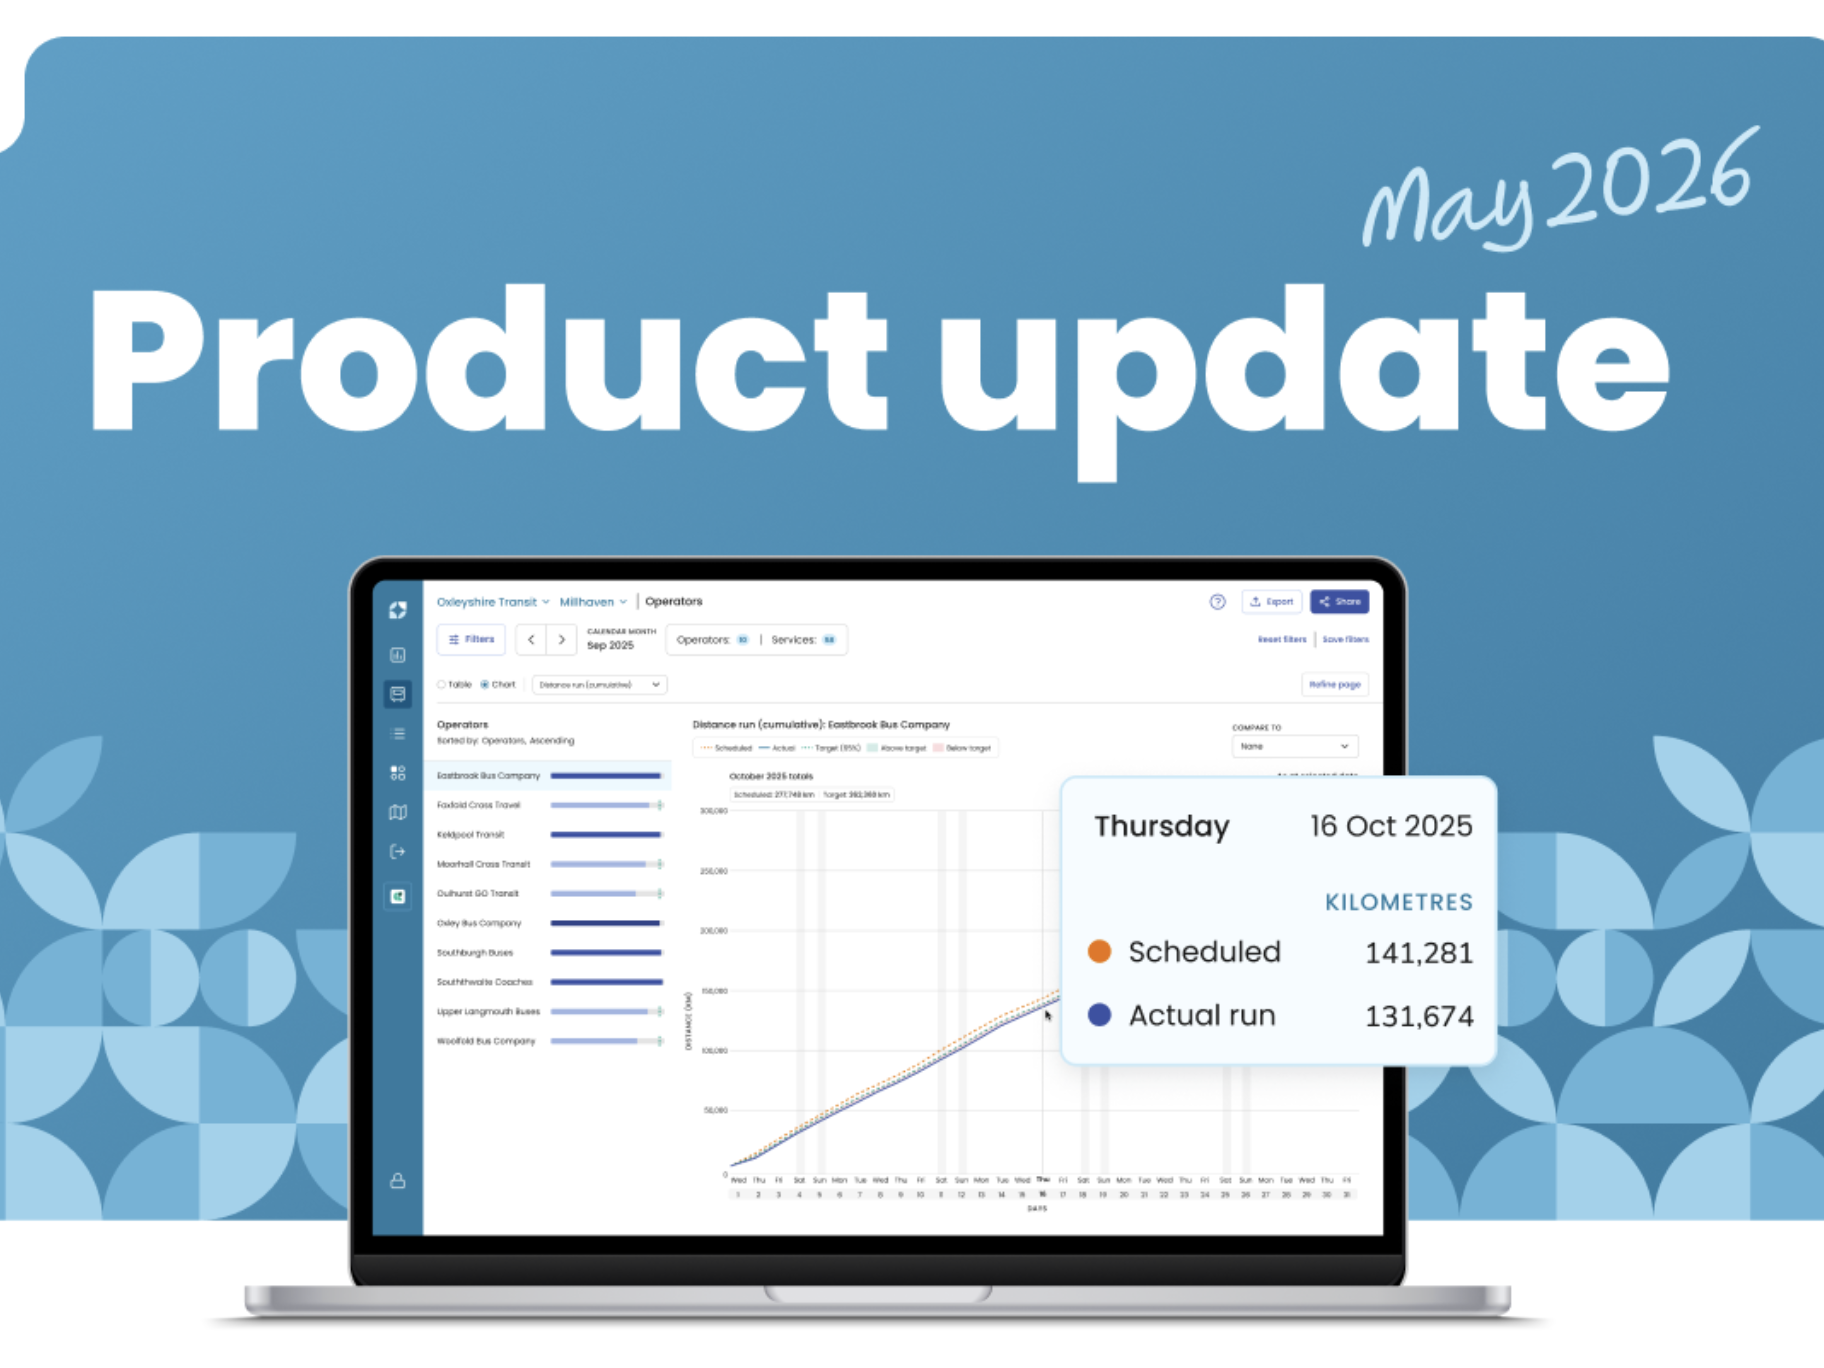
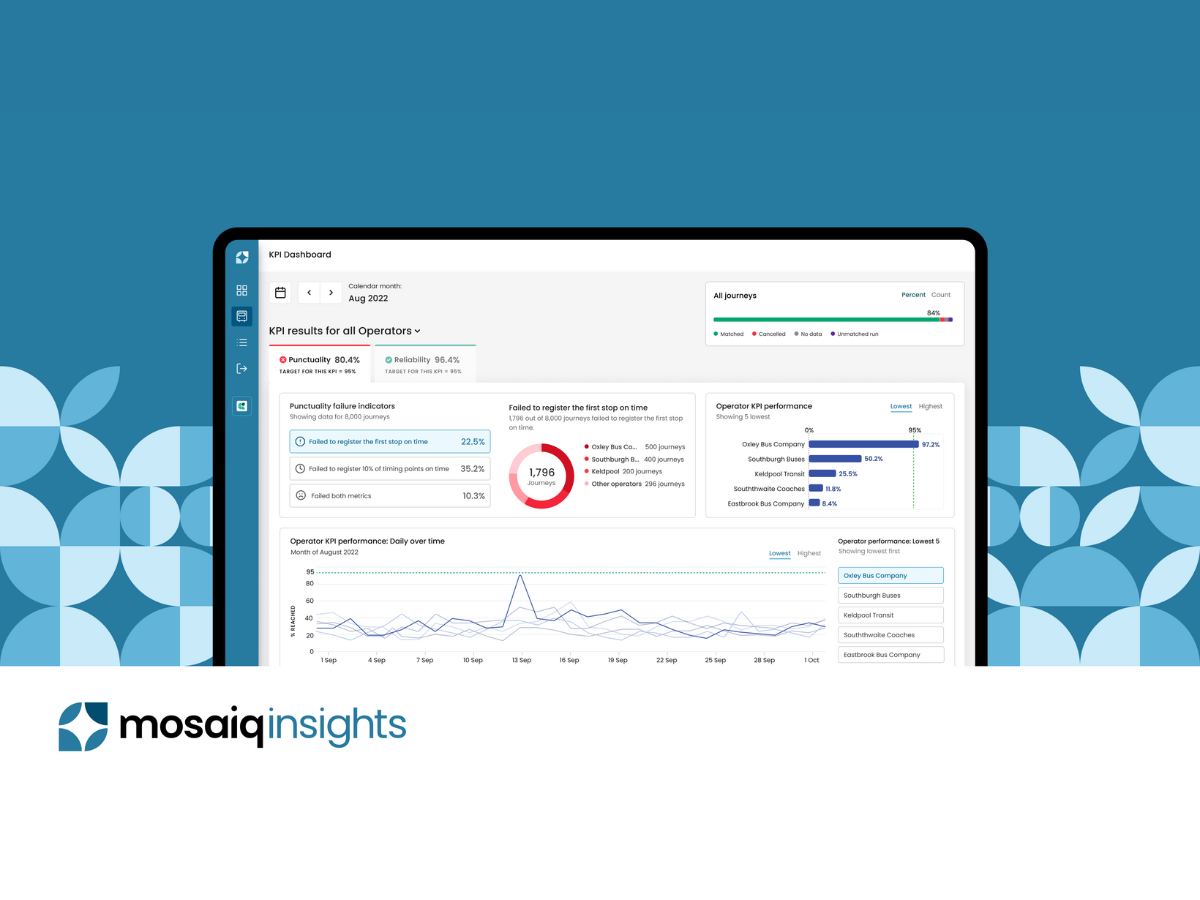
Mosaiq Insights already does the heavy lifting to surface problem areas in your network proactively. We’ve built two gorgeous new views into Mosaiq Insights, designed purposefully to make reporting and problem-solving a breeze.
For services that consistently perform poorly, identify patterns in performance is essential. The Journeys List shows all the scheduled and unscheduled trips over a time period. It uses intuitive colour coding, brilliant filters and simple visual signals to direct you to cancelled trips, missing data, and early- or late-starting trips.
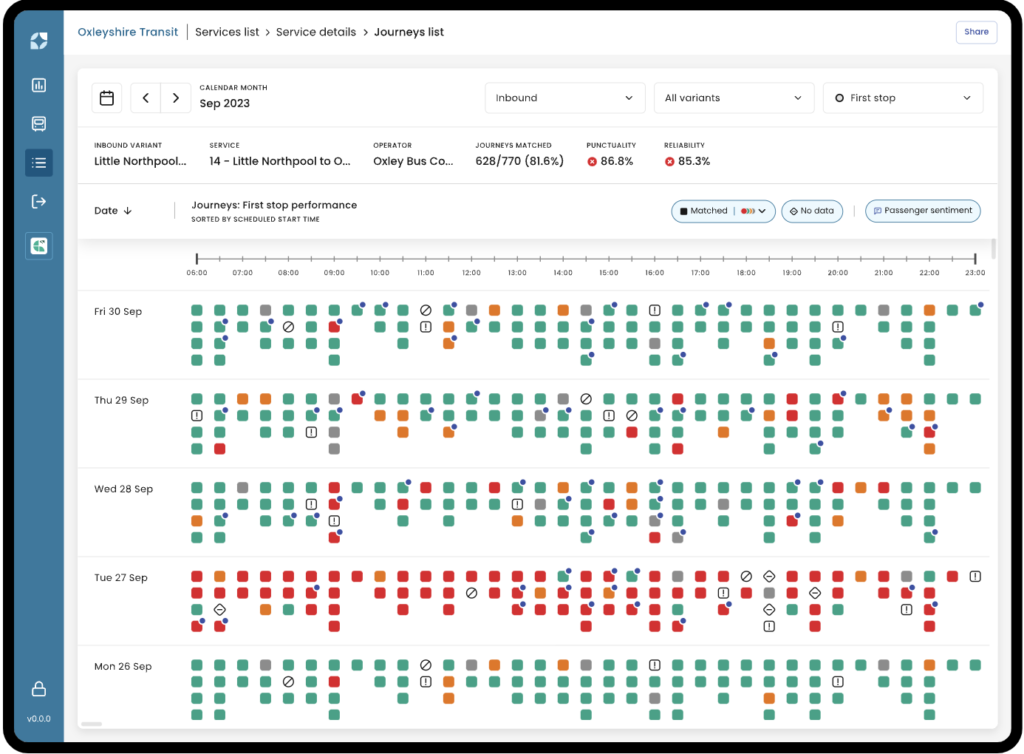
The Journeys List makes on-time performance reporting effortless. It’s faster and easier than ever to find and prioritise the most significant improvement areas, monitor the results of your optimisation efforts, and answer important questions like: Which trips are continuously starting early? Which time bands have the most drivers struggling to stick to schedule?
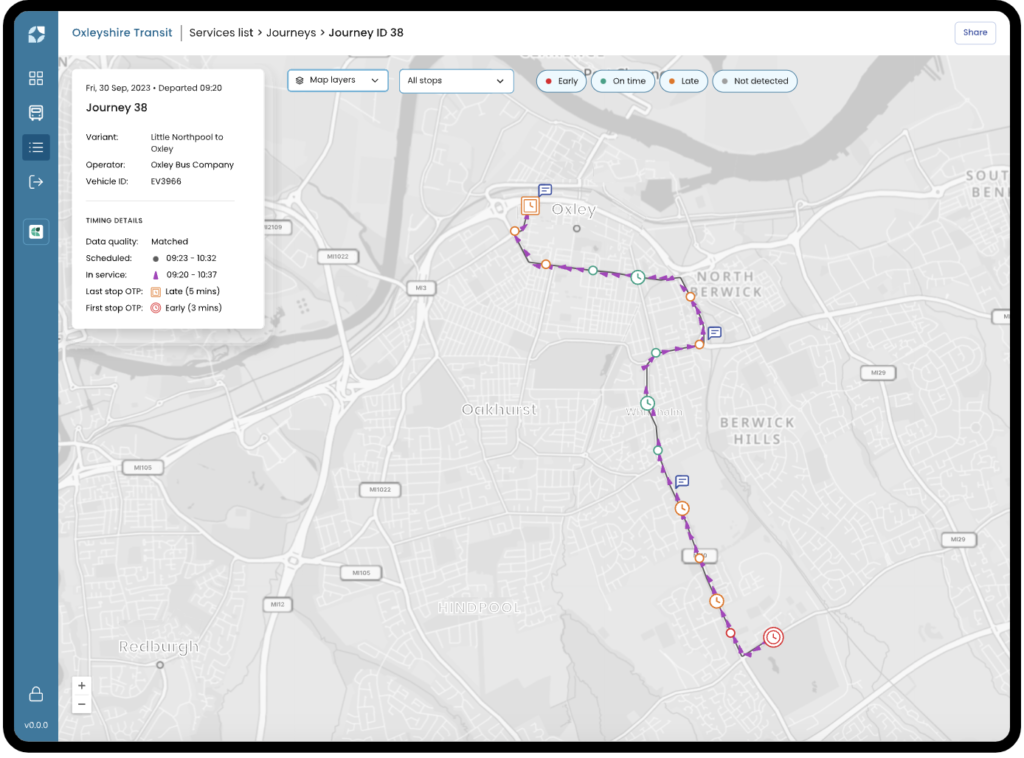
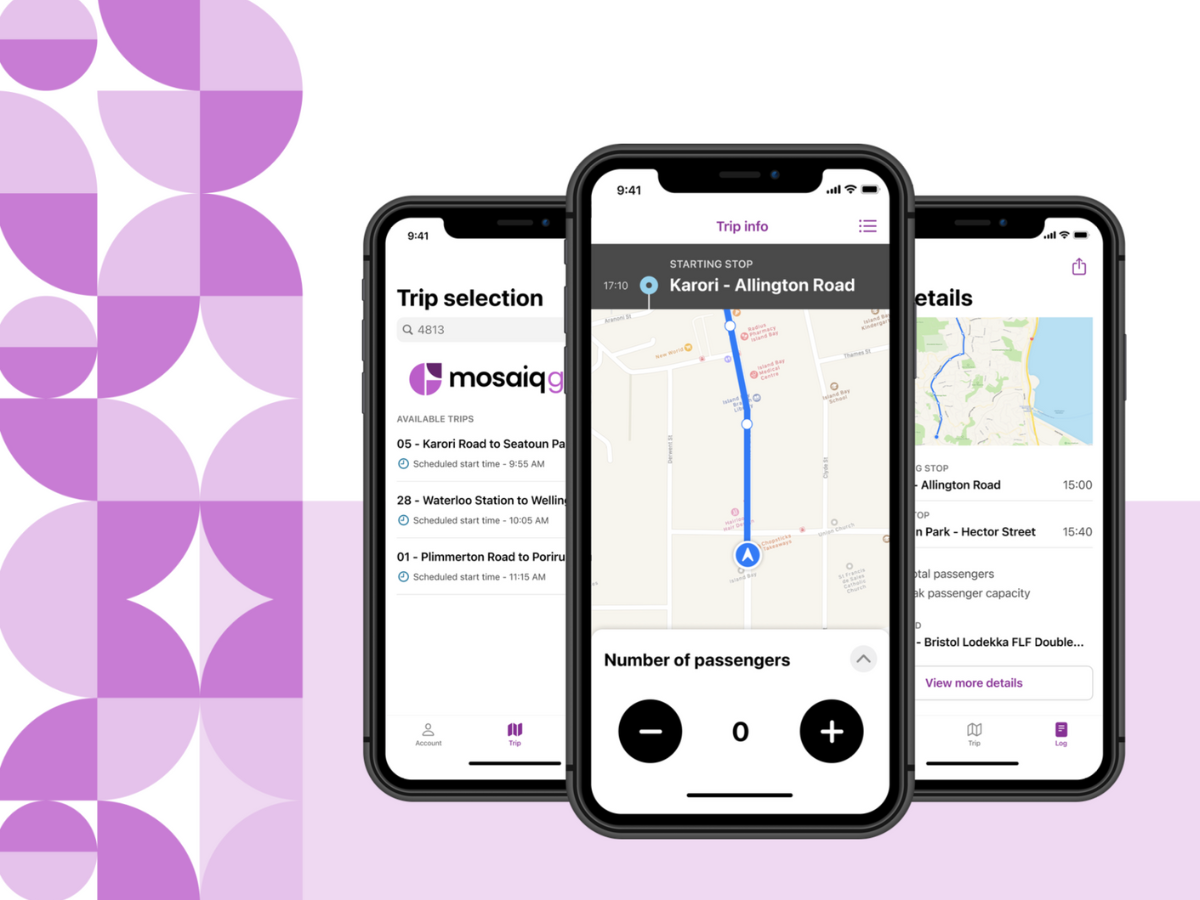
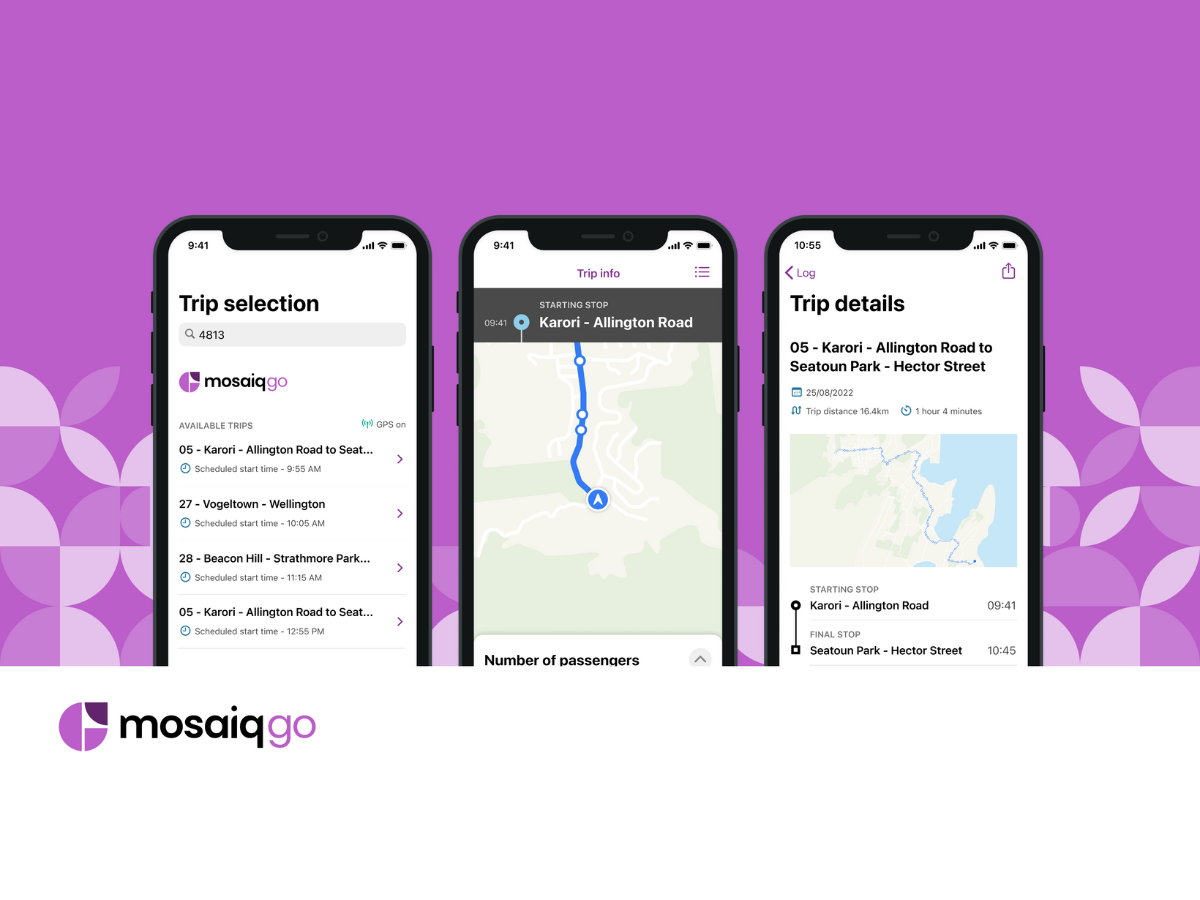
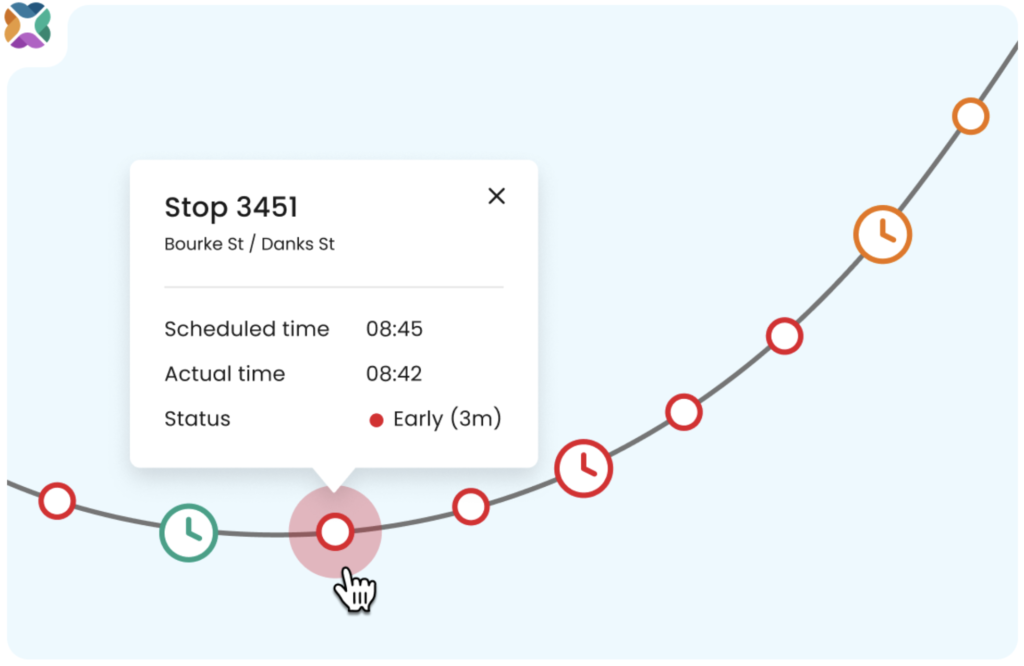
Need to dig a bit deeper? Select any trip to head to the Journey view and see the real trip on the map as it happened. Time-stamped location heartbeats are mapped to the bus’s actual route, revealing pinch points and other underlying issues in the network. This knowledge can then be used to make targeted improvements in infrastructure and scheduling.
From the Big Picture to the Fine Detail: Experience It Yourself
Mosaiq Insights guides users seamlessly from a birds-eye view of the network to a comprehensive overview of an individual trip. Take a quick tour through Mosaiq Insights below, or register for your free Mosaiq Insights trial here.
This article was originally published by Snapper Services.