See What’s Hidden between Your Agency’s Timepoints
Swiftly has made a small product update to our transit data platform with a big impact for quickly identifying trends in a route’s on time performance.
Studies show that service reliability, especially high schedule adherence, is associated with greater ridership. But if an agency only tracks on-time performance at timepoints, this metric does not reflect the passenger experience. Riders that board at a stop that is not a timepoint may experience the impacts of on-time performance issues that are not reflected in the data. Fixing on-time performance issues at all stops, and not just timepoints, can have a big impact on customer experience and increasing and retaining riders.
But you can’t fix what you don’t measure! This is why Swiftly has always provided on-time performance for all stops, as well as timepoints, in the On-Time Performance product.
Now, with a recent update, timepoints are annotated with an asterisk in the Stops and Schedule views of On-Time Performance. This new annotation allows users to quickly visualize schedule adherence between the timepoints.
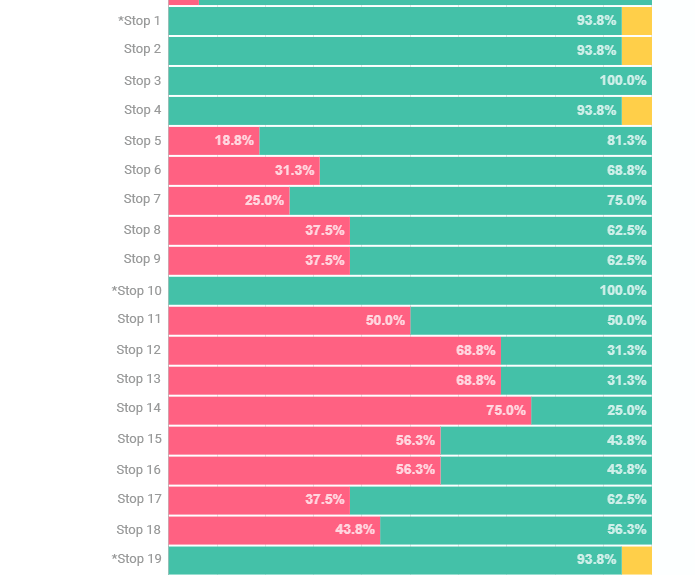
The images here are of a transit agency’s real-world, anonymized on-time performance data. Figure 1 shows the On-Time Performance Stops view with the new timepoint annotation feature. With just a glance, it’s easy to see that there is significant rushing between timepoints. If you’re a passenger and you board this route at Stop #14 every day, this means that the bus departs your stop early 3 out of 4 times, even though a timepoints-only report would show a route on-time performance greater than 93 percent.
Moreover, the operator may be dwelling at timepoints for several minutes to get back on schedule, which passengers perceive as a delay as they wait for the bus to move again. This also may be indicative that this is a challenging schedule for operators to adhere to. This data then empowers the agency to make changes either to the schedule, with operator coaching, or other operational adjustments to improve schedule adherence. None of these changes are possible if agencies can’t easily access this data.
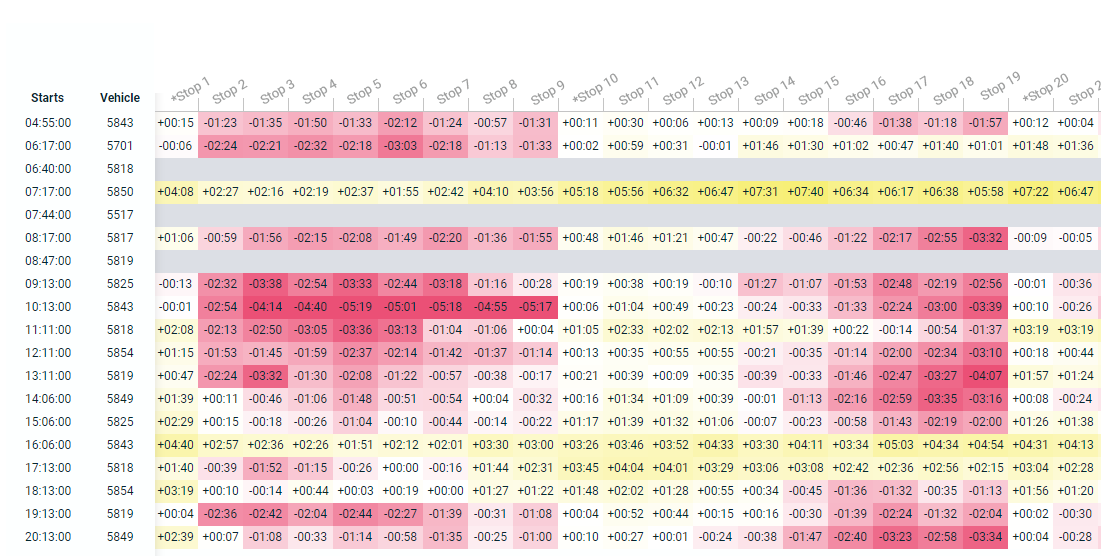
The On-Time Performance Schedule view (Figure 2) provides a look at what on-time performance issues may be hidden between the timepoints at the individual trip level throughout a single day. This view can aid with investigations for certain days or by time of day.
Similar to the Stops view, Figure 2 shows that the same pattern of rushing and holding at timepoints is fairly consistent across trips and time of day. Also, for certain trips, it’s evident that early departures continue to worsen as the trip progresses, with some trips departing beginning stops 2 minutes early and departing later stops a rather severe 5 minutes early.
Empowering agencies with easily accessible data that reflects the transit rider experience is core to Swiftly’s mission. We hope this small update helps make a big difference. Learn more from an experienced transit scheduler on how to avoid the vicious cycle of timepoints using Swiftly data.
This article was originally published by Swiftly.